

New data visualization capabilities in Excel 2016
This post might contain affiliate links. We may earn a commission if you click and make a purchase. Your support is appreciated!
Microsoft has announced the further expansion of their BI tool environment at this year’s MSIgnite. Within the new Office 2016, especially Excel 2016 comes with new business analytics features and possibilities of graphical representations.
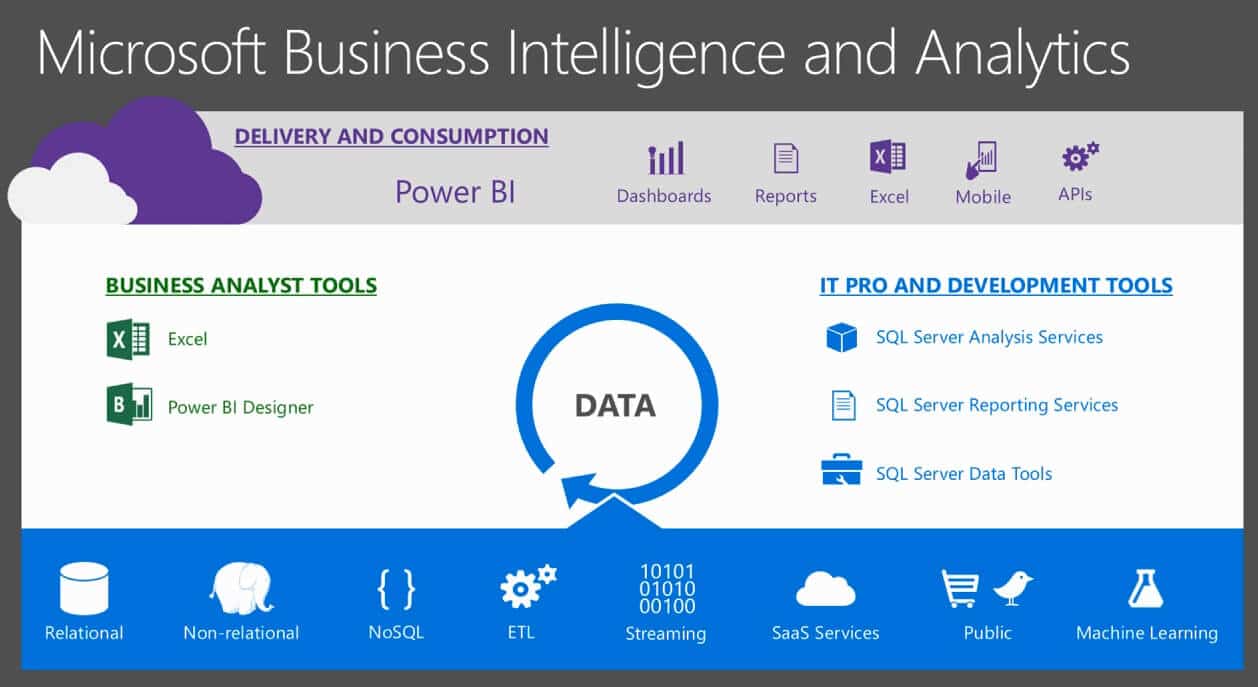
Excel at least since the version of 2007 is one of the business analytics tools in Power BI with Microsoft SQL Server. In the new upcoming version analysts, developers and end users will grow closer together. Everything revolves around the relevant data, which are determined from the SQL Server components such as Analysis Server or Reporting Services, processed and aggregated through Power-BI Designer and Excel (of course combinable and integrated) and finally brought to the end user via graphical dashboards or pretty displayed (for example) in new Excel Charts. So they can be used for better decision-making or to support business processes.
When you take a look at the path of business intelligence integration in Excel since the 2007 version, then there were more and more functions integrated (for example, in Excel 2010: several sparklines and a optimized Icon Set), now with Excel 2013 new effective data evaluation possibilities which enable an enhanced visualization of processes or existing numbers have been added.
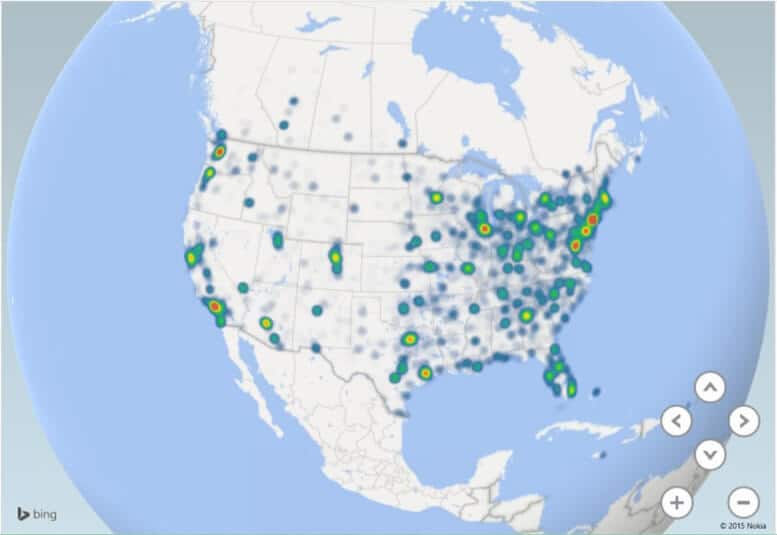
Now Microsoft has taken the next step: Excel 2016 adds even more analytical and visual tools for data analysis and presentation of statistics and business transactions. For example such great features like treemap, sunburst or waterfall charts or the integration of power maps are coming up.
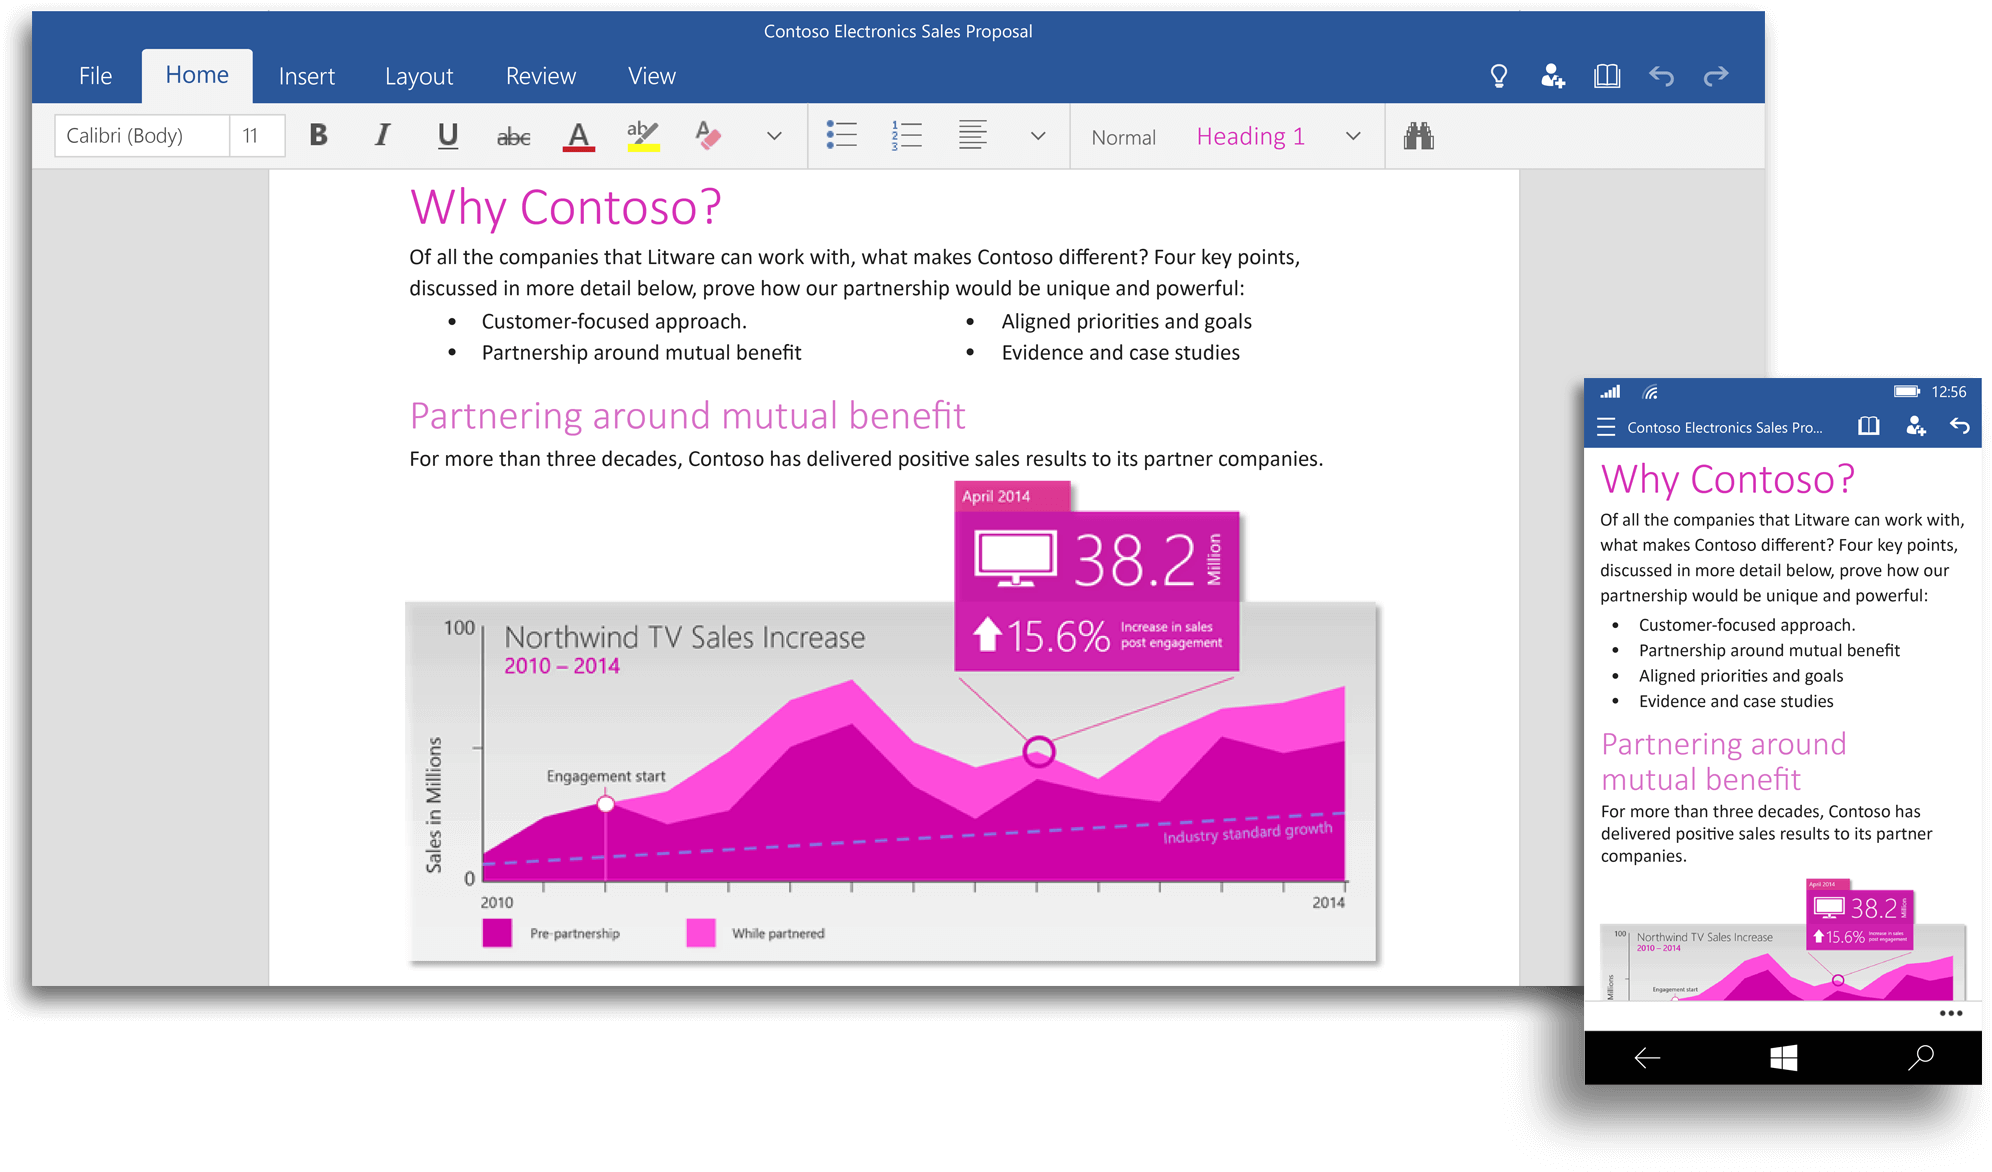
With the new Office package also comes a fundamentally optimized presentation all products on mobile devices. Now documents scale better, faster and easier in the viewport, thus improving the operability of the Office products.
Who wants to know more about the great new Business Analytics and visualization with Power BI and Excel should definitely watch the video of Scott Ruble on Channel 9, here he explains the individual charts and their options in detail and with reference to figures and examples.
This post might contain affiliate links. We may earn a commission if you click and make a purchase. Your support is appreciated!
Björn continues to work from Greece as a Senior Consultant – Microsoft Data Platform and Cloud for Kramer&Crew in Cologne. He also remains loyal to the community from his new home, he is involved in Data Saturdays or in various forums. Besides the topics around SQL Server, Powershell and Azure SQL, he is interested in science fiction, baking 😉 and cycling.
Amazon.com Empfehlungen
Damit ich auch meine Kosten für den Blog ein wenig senken kann, verwende ich auf diese Seite das Amazon.com Affiliate Programm, so bekomme ich - falls ihr ein Produkt über meinen Link kauft, eine kleine Provision (ohne zusätzliche Kosten für euch!).
Auto Amazon Links: No products found.